Brown-headed Honeyeater
Melithreptus brevirostris
ABR description
The following is extracted from the Annual Bird Report for the twelve months to June 2017.
Common, breeding resident
A species of drier forests at all altitudes.
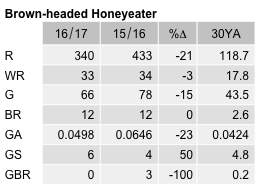
General: Number of records, number of birds and reporting rate of 2.5% all lower than last year, and reporting rate less than half the 30YA. WOO records similar to last year. Lowest proportion of records in autumn (14%). Max 20/1 Jul MFNR (ClJ3), mean 3.8, median 3. 12 breeding records, same as last year: first nb/9 Oct Michelago (MaS3), last dy/7 Apr MFNR (ClJ3).
GBS: 36 records, 38 last year, from only 6 sites. Records from 2 rural sites: 22 Wamboin GrQ12 (CoK2), 4 Carwoola (BuM1); and4 suburban sites: 5 Giralang GrK12, 3 Chapman GrI15, 1 each Cook GrJ13 and Red Hill GrK14. Mostly observed in groups of 3-10. Abundance A=0.0498 was lower than last year, but still above the 30YA.
Abundance
Abundance is the average number of birds of that species per survey. Where the species was observed (presence recorded) but the number of birds seen was not recorded, this is treated as a count of zero.
Abundance by year
This chart shows the abundance of Brown-headed Honeyeater between 1982 and 2017. 
Abundance by month
This chart shows the monthly abundance of Brown-headed Honeyeater. The blue lines show the abundance for the twelve months to June 2017 and the bars show the average abundance for the period 1982 to 2017. 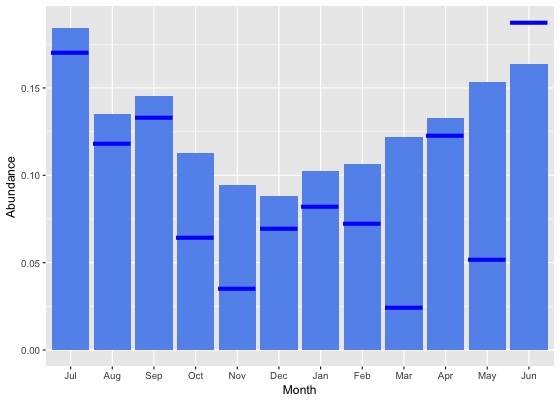
Abundance by season
This chart shows the seasonal abundance of Brown-headed Honeyeater. The blue lines show the seasonal abundance for the twelve months to June 2017 and the bars show the average seasonal abundance for the period 1982 to 2017. 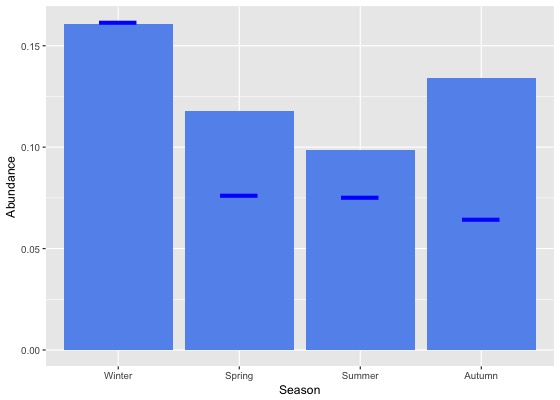
Abundance data
| Month | Season | ||||||||||||||||||
|---|---|---|---|---|---|---|---|---|---|---|---|---|---|---|---|---|---|---|---|
| Period | Jul | Aug | Sep | Oct | Nov | Dec | Jan | Feb | Mar | Apr | May | Jun | Winter | Spring | Summer | Autumn | All | ||
| All years | |||||||||||||||||||
| All | 0.2 | 0.1 | 0.1 | 0.1 | 0.1 | 0.1 | 0.1 | 0.1 | 0.1 | 0.1 | 0.2 | 0.2 | 0.2 | 0.1 | 0.1 | 0.1 | 0.1 | ||
| Previous years | |||||||||||||||||||
| All previous years | 0.2 | 0.1 | 0.1 | 0.1 | 0.1 | 0.1 | 0.1 | 0.1 | 0.1 | 0.1 | 0.2 | 0.2 | 0.2 | 0.1 | 0.1 | 0.1 | 0.1 | ||
| Previous 30 years | 0.2 | 0.1 | 0.1 | 0.1 | 0.1 | 0.1 | 0.1 | 0.1 | 0.1 | 0.1 | 0.2 | 0.2 | 0.2 | 0.1 | 0.1 | 0.1 | 0.1 | ||
| Previous 20 years | 0.2 | 0.2 | 0.2 | 0.1 | 0.1 | 0.1 | 0.1 | 0.1 | 0.1 | 0.1 | 0.2 | 0.2 | 0.2 | 0.1 | 0.1 | 0.2 | 0.1 | ||
| 10 year groups | |||||||||||||||||||
| [2007,2017) | 0.2 | 0.2 | 0.2 | 0.1 | 0.1 | 0.1 | 0.1 | 0.1 | 0.2 | 0.1 | 0.2 | 0.2 | 0.2 | 0.1 | 0.1 | 0.2 | 0.2 | ||
| [1997,2007) | 0.2 | 0.1 | 0.1 | 0.1 | 0.1 | 0.1 | 0.1 | 0.1 | 0.1 | 0.1 | 0.3 | 0.2 | 0.1 | 0.1 | 0.1 | 0.1 | 0.1 | ||
| [1987,1997) | 0.1 | 0.1 | 0.1 | 0.1 | 0.1 | 0.1 | 0.1 | 0.1 | 0.1 | 0.1 | 0.1 | 0.1 | 0.1 | 0.1 | 0.1 | 0.1 | 0.1 | ||
| 5 year groups | |||||||||||||||||||
| [2012,2017) | 0.2 | 0.2 | 0.2 | 0.2 | 0.1 | 0.1 | 0.1 | 0.1 | 0.2 | 0.1 | 0.2 | 0.2 | 0.2 | 0.2 | 0.1 | 0.2 | 0.2 | ||
| [2007,2012) | 0.2 | 0.2 | 0.1 | 0.1 | 0.2 | 0.1 | 0.1 | 0.2 | 0.2 | 0.1 | 0.2 | 0.1 | 0.2 | 0.1 | 0.1 | 0.2 | 0.1 | ||
| [2002,2007) | 0.2 | 0.1 | 0.1 | 0.1 | 0.1 | 0.1 | 0.1 | 0.1 | 0.1 | 0.1 | 0.3 | 0.2 | 0.2 | 0.1 | 0.1 | 0.2 | 0.1 | ||
| [1997,2002) | 0.1 | 0.0 | 0.1 | 0.1 | 0.1 | 0.1 | 0.1 | 0.1 | 0.1 | 0.1 | 0.2 | 0.1 | 0.1 | 0.1 | 0.1 | 0.1 | 0.1 | ||
| [1992,1997) | 0.2 | 0.1 | 0.2 | 0.1 | 0.1 | 0.1 | 0.2 | 0.1 | 0.2 | 0.2 | 0.2 | 0.2 | 0.2 | 0.1 | 0.1 | 0.2 | 0.2 | ||
| [1987,1992) | 0.0 | 0.1 | 0.1 | 0.1 | 0.1 | 0.1 | 0.1 | 0.1 | 0.1 | 0.1 | 0.0 | 0.1 | 0.1 | 0.1 | 0.1 | 0.1 | 0.1 | ||
| Year | |||||||||||||||||||
| 2017 | 0.2 | 0.1 | 0.1 | 0.1 | 0.0 | 0.1 | 0.1 | 0.1 | 0.0 | 0.1 | 0.1 | 0.2 | 0.2 | 0.1 | 0.1 | 0.1 | 0.1 | ||
| 2016 | 0.3 | 0.3 | 0.2 | 0.2 | 0.1 | 0.1 | 0.1 | 0.1 | 0.1 | 0.1 | 0.1 | 0.2 | 0.2 | 0.2 | 0.1 | 0.1 | 0.2 | ||
| 2015 | 0.3 | 0.2 | 0.3 | 0.2 | 0.1 | 0.1 | 0.2 | 0.2 | 0.2 | 0.1 | 0.3 | 0.2 | 0.2 | 0.2 | 0.2 | 0.2 | 0.2 | ||
| 2014 | 0.3 | 0.1 | 0.1 | 0.1 | 0.0 | 0.1 | 0.1 | 0.2 | 0.2 | 0.2 | 0.1 | 0.3 | 0.2 | 0.1 | 0.1 | 0.2 | 0.1 | ||
| 2013 | 0.1 | 0.1 | 0.1 | 0.2 | 0.1 | 0.1 | 0.2 | 0.1 | 0.2 | 0.2 | 0.2 | 0.2 | 0.1 | 0.1 | 0.1 | 0.2 | 0.1 | ||
| 2012 | 0.2 | 0.1 | 0.1 | 0.1 | 0.1 | 0.1 | 0.1 | 0.1 | 0.1 | 0.2 | 0.2 | 0.1 | 0.1 | 0.1 | 0.1 | 0.2 | 0.1 | ||
| 2011 | 0.3 | 0.2 | 0.1 | 0.1 | 0.3 | 0.1 | 0.1 | 0.2 | 0.1 | 0.1 | 0.0 | 0.0 | 0.1 | 0.2 | 0.1 | 0.1 | 0.1 | ||
| 2010 | 0.3 | 0.1 | 0.1 | 0.1 | 0.1 | 0.0 | 0.1 | 0.1 | 0.2 | 0.2 | 0.3 | 0.2 | 0.2 | 0.1 | 0.1 | 0.2 | 0.1 | ||
| 2009 | 0.1 | 0.2 | 0.1 | 0.1 | 0.1 | 0.1 | 0.1 | 0.1 | 0.2 | 0.2 | 0.1 | 0.1 | 0.1 | 0.1 | 0.1 | 0.2 | 0.1 | ||
| 2008 | 0.3 | 0.2 | 0.2 | 0.1 | 0.2 | 0.1 | 0.1 | 0.2 | 0.3 | 0.2 | 0.2 | 0.2 | 0.3 | 0.1 | 0.1 | 0.2 | 0.2 | ||
| 2007 | 0.3 | 0.2 | 0.2 | 0.1 | 0.1 | 0.2 | 0.2 | 0.2 | 0.1 | 0.2 | 0.4 | 0.2 | 0.2 | 0.1 | 0.2 | 0.2 | 0.2 | ||
| 2006 | 0.2 | 0.0 | 0.1 | 0.2 | 0.1 | 0.1 | 0.1 | 0.0 | 0.2 | 0.2 | 0.2 | 0.2 | 0.2 | 0.2 | 0.1 | 0.2 | 0.1 | ||
| 2005 | 0.1 | 0.0 | 0.2 | 0.1 | 0.1 | 0.0 | 0.1 | 0.1 | 0.0 | 0.0 | 0.2 | 0.2 | 0.1 | 0.1 | 0.1 | 0.1 | 0.1 | ||
| 2004 | 0.1 | 0.2 | 0.1 | 0.0 | 0.1 | 0.1 | 0.0 | 0.1 | 0.1 | 0.3 | 0.1 | 0.2 | 0.2 | 0.1 | 0.0 | 0.2 | 0.1 | ||
| 2003 | 0.2 | 0.2 | 0.1 | 0.1 | 0.1 | 0.1 | 0.0 | 0.1 | 0.2 | 0.1 | 0.6 | 0.2 | 0.2 | 0.1 | 0.1 | 0.3 | 0.1 | ||
| 2002 | 0.2 | 0.0 | 0.1 | 0.1 | 0.1 | 0.1 | 0.1 | 0.2 | 0.2 | 0.0 | 0.3 | 0.2 | 0.2 | 0.1 | 0.1 | 0.1 | 0.1 | ||
| 2001 | 0.2 | 0.1 | 0.1 | 0.1 | 0.0 | 0.1 | 0.1 | 0.1 | 0.1 | 0.1 | 0.2 | 0.1 | 0.1 | 0.1 | 0.1 | 0.1 | 0.1 | ||
| 2000 | 0.1 | 0.0 | 0.1 | 0.1 | 0.1 | 0.1 | 0.0 | 0.1 | 0.1 | 0.1 | 0.3 | 0.2 | 0.1 | 0.1 | 0.1 | 0.1 | 0.1 | ||
| 1999 | 0.1 | 0.1 | 0.1 | 0.1 | 0.1 | 0.1 | 0.1 | 0.2 | 0.1 | 0.1 | 0.3 | 0.2 | 0.1 | 0.1 | 0.1 | 0.2 | 0.1 | ||
| 1998 | 0.0 | 0.0 | 0.1 | 0.0 | 0.1 | 0.1 | 0.3 | 0.0 | 0.0 | 0.0 | 0.0 | 0.0 | 0.0 | 0.1 | 0.1 | 0.0 | 0.1 | ||
| 1997 | 0.1 | 0.0 | 0.1 | 0.0 | 0.1 | 0.1 | 0.1 | 0.1 | 0.0 | 0.1 | 0.0 | 0.2 | 0.1 | 0.1 | 0.1 | 0.0 | 0.1 | ||
| 1996 | 0.1 | 0.1 | 0.5 | 0.0 | 0.1 | 0.1 | 0.1 | 0.0 | 0.3 | 0.1 | 0.3 | 0.2 | 0.1 | 0.1 | 0.1 | 0.2 | 0.1 | ||
| 1995 | 0.4 | 0.0 | 0.0 | 0.0 | 0.1 | 0.1 | 0.4 | 0.1 | 0.1 | 0.1 | 0.2 | 0.3 | 0.2 | 0.1 | 0.2 | 0.1 | 0.1 | ||
| 1994 | 0.5 | 0.2 | 0.0 | 0.1 | 0.1 | 0.2 | 0.2 | 0.0 | 0.0 | 0.6 | 0.2 | 0.0 | 0.2 | 0.1 | 0.1 | 0.3 | 0.2 | ||
| 1993 | 0.0 | 0.2 | 0.3 | 0.1 | 0.3 | 0.0 | 0.1 | 0.0 | 0.4 | 0.0 | 0.2 | 0.4 | 0.2 | 0.2 | 0.0 | 0.2 | 0.2 | ||
| 1992 | 0.1 | 0.0 | 0.2 | 0.2 | 0.3 | 0.0 | 0.1 | 0.2 | 0.1 | 0.0 | 0.0 | 0.0 | 0.0 | 0.2 | 0.1 | 0.0 | 0.1 | ||
| 1991 | 0.0 | 0.1 | 0.4 | 0.1 | 0.1 | 0.0 | 0.1 | 0.1 | 0.0 | 0.3 | 0.0 | 0.2 | 0.1 | 0.2 | 0.1 | 0.1 | 0.1 | ||
| 1990 | 0.1 | 0.1 | 0.1 | 0.0 | 0.0 | 0.1 | 0.2 | 0.1 | 0.2 | 0.2 | 0.1 | 0.0 | 0.1 | 0.0 | 0.1 | 0.2 | 0.1 | ||
| 1989 | 0.1 | 0.1 | 0.1 | 0.1 | 0.1 | 0.1 | 0.1 | 0.1 | 0.1 | 0.1 | 0.0 | 0.0 | 0.1 | 0.1 | 0.1 | 0.1 | 0.1 | ||
| 1988 | 0.1 | 0.1 | 0.1 | 0.1 | 0.1 | 0.1 | 0.1 | 0.1 | 0.0 | 0.0 | 0.1 | 0.1 | 0.1 | 0.1 | 0.1 | 0.0 | 0.1 | ||
| 1987 | 0.0 | 0.0 | 0.0 | 0.0 | 0.1 | 0.1 | 0.0 | 0.0 | 0.1 | 0.1 | 0.0 | 0.0 | 0.0 | 0.0 | 0.0 | 0.1 | 0.0 | ||
| 1986 | 0.0 | 0.2 | 0.0 | 0.0 | 0.0 | 0.0 | 0.0 | 0.0 | 0.0 | 0.0 | 0.0 | 0.0 | 0.1 | 0.0 | 0.0 | 0.0 | 0.0 | ||
| 1985 | 0.0 | 0.0 | 0.0 | 0.0 | 0.0 | 0.0 | 0.0 | 0.0 | 0.0 | 0.0 | 0.0 | 0.0 | 0.0 | 0.0 | 0.0 | 0.0 | 0.0 | ||
| 1984 | 0.0 | 0.0 | 0.0 | 0.0 | 0.0 | 0.0 | 0.0 | 0.0 | 0.0 | 0.0 | 0.0 | 0.0 | 0.0 | 0.0 | 0.0 | 0.0 | 0.0 | ||
| 1983 | 0.0 | 0.0 | 0.0 | 0.0 | 0.0 | 0.0 | 0.0 | 0.0 | 0.0 | - | 0.0 | 0.0 | 0.0 | 0.0 | 0.0 | 0.0 | 0.0 | ||
| 1982 | - | 0.0 | - | 0.0 | 0.0 | 0.0 | - | 0.0 | - | 0.0 | - | 0.0 | 0.0 | 0.0 | 0.0 | 0.0 | 0.0 | ||
Reporting rates
Reporting rate is the proportion of all surveys in which the species was present.
Reporting rate by year
This chart shows the reporting rate of Brown-headed Honeyeater each year between 1982 and 2017. 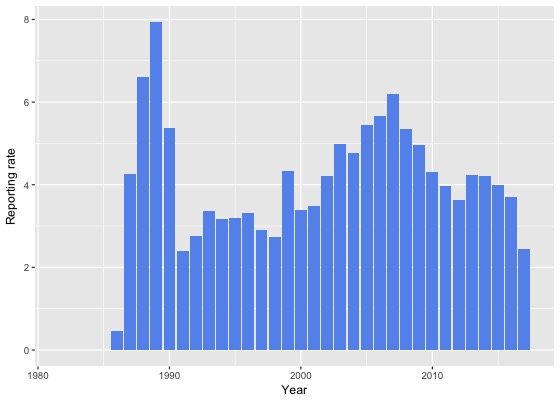
Reporting rate by month
This chart shows the reporting rate by month of Brown-headed Honeyeater. The blue lines show the reporting rate for the twelve months to June 2017 and the bars show the average reporting rate for the period 1982 to 2017. 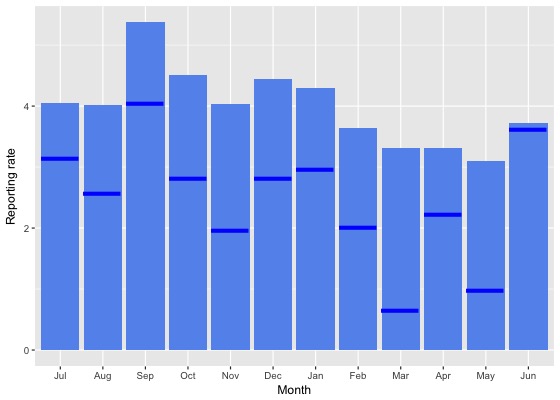
Reporting rate by season
This chart shows the seasonal reporting rate of Brown-headed Honeyeater. The blue lines show the seasonal reporting rate for the twelve months to June 2017 and the bars show the average seasonal reporting rate for the period 1982 to 2017. 
Reporting rate data
| Month | Season | ||||||||||||||||||
|---|---|---|---|---|---|---|---|---|---|---|---|---|---|---|---|---|---|---|---|
| Period | Jul | Aug | Sep | Oct | Nov | Dec | Jan | Feb | Mar | Apr | May | Jun | Winter | Spring | Summer | Autumn | All | ||
| All years | |||||||||||||||||||
| All | 4.0 | 4.0 | 5.4 | 4.5 | 4.0 | 4.4 | 4.3 | 3.6 | 3.3 | 3.3 | 3.1 | 3.7 | 3.9 | 4.6 | 4.2 | 3.3 | 4.0 | ||
| Previous years | |||||||||||||||||||
| All previous years | 4.2 | 4.3 | 5.6 | 4.7 | 4.4 | 4.7 | 4.5 | 4.0 | 3.8 | 3.5 | 3.6 | 3.7 | 4.0 | 4.9 | 4.4 | 3.6 | 4.3 | ||
| Previous 30 years | 4.2 | 4.4 | 5.6 | 4.8 | 4.4 | 4.8 | 4.6 | 4.1 | 3.8 | 3.5 | 3.6 | 3.8 | 4.1 | 5.0 | 4.5 | 3.7 | 4.4 | ||
| Previous 20 years | 4.3 | 4.1 | 5.7 | 4.9 | 4.2 | 4.6 | 4.2 | 3.6 | 3.6 | 3.4 | 3.8 | 3.8 | 4.0 | 5.0 | 4.2 | 3.6 | 4.2 | ||
| 10 year groups | |||||||||||||||||||
| [2007,2017) | 4.6 | 4.4 | 5.7 | 5.2 | 3.8 | 4.6 | 4.2 | 3.3 | 3.6 | 3.2 | 3.3 | 3.6 | 4.1 | 5.0 | 4.1 | 3.4 | 4.2 | ||
| [1997,2007) | 4.0 | 3.3 | 5.9 | 3.9 | 4.9 | 4.7 | 4.2 | 4.4 | 3.6 | 4.0 | 4.9 | 4.2 | 3.9 | 4.9 | 4.5 | 4.0 | 4.4 | ||
| [1987,1997) | 3.9 | 5.2 | 5.2 | 4.2 | 5.4 | 5.5 | 7.0 | 6.1 | 5.0 | 4.3 | 3.1 | 4.0 | 4.4 | 4.9 | 6.2 | 4.2 | 4.9 | ||
| 5 year groups | |||||||||||||||||||
| [2012,2017) | 4.4 | 4.0 | 5.3 | 5.3 | 2.8 | 4.1 | 3.7 | 2.9 | 3.5 | 3.2 | 3.4 | 3.5 | 3.9 | 4.7 | 3.6 | 3.4 | 3.9 | ||
| [2007,2012) | 5.1 | 5.9 | 6.4 | 5.0 | 6.5 | 5.7 | 5.8 | 5.1 | 4.1 | 3.0 | 3.1 | 3.8 | 4.6 | 5.7 | 5.6 | 3.4 | 4.9 | ||
| [2002,2007) | 4.6 | 4.5 | 7.0 | 5.0 | 5.3 | 4.7 | 3.9 | 4.5 | 4.4 | 5.2 | 6.2 | 4.6 | 4.6 | 5.8 | 4.4 | 5.1 | 5.0 | ||
| [1997,2002) | 2.9 | 1.9 | 4.5 | 2.3 | 4.4 | 4.7 | 4.6 | 4.3 | 2.5 | 2.5 | 3.2 | 3.5 | 2.9 | 3.8 | 4.5 | 2.6 | 3.5 | ||
| [1992,1997) | 1.8 | 3.0 | 3.6 | 3.6 | 4.1 | 2.3 | 4.9 | 2.5 | 3.4 | 3.0 | 2.7 | 2.3 | 2.4 | 3.7 | 3.4 | 3.0 | 3.2 | ||
| [1987,1992) | 4.9 | 6.4 | 6.0 | 4.5 | 6.0 | 6.9 | 8.2 | 7.5 | 5.9 | 5.1 | 3.2 | 5.0 | 5.5 | 5.5 | 7.5 | 4.8 | 5.8 | ||
| Year | |||||||||||||||||||
| 2017 | 3.1 | 2.6 | 4.0 | 2.8 | 2.0 | 2.8 | 3.0 | 2.0 | 0.6 | 2.2 | 1.0 | 3.6 | 3.2 | 2.9 | 2.6 | 1.3 | 2.5 | ||
| 2016 | 4.4 | 4.7 | 4.8 | 5.2 | 3.0 | 3.9 | 3.3 | 3.0 | 2.8 | 3.1 | 3.1 | 3.1 | 4.1 | 4.5 | 3.4 | 3.0 | 3.7 | ||
| 2015 | 4.7 | 3.6 | 6.9 | 5.3 | 3.4 | 4.5 | 3.3 | 3.3 | 4.3 | 2.2 | 3.0 | 3.2 | 3.7 | 5.2 | 3.7 | 3.2 | 4.0 | ||
| 2014 | 7.3 | 3.8 | 7.0 | 5.5 | 1.5 | 4.9 | 3.1 | 2.7 | 3.6 | 4.3 | 3.3 | 4.4 | 4.8 | 5.1 | 3.4 | 3.8 | 4.2 | ||
| 2013 | 1.8 | 2.3 | 3.4 | 5.9 | 3.6 | 4.3 | 5.7 | 2.3 | 4.4 | 4.0 | 5.0 | 5.1 | 3.2 | 4.5 | 4.3 | 4.3 | 4.2 | ||
| 2012 | 4.3 | 4.3 | 4.2 | 5.0 | 1.6 | 3.0 | 4.0 | 2.9 | 2.4 | 3.9 | 3.7 | 2.4 | 3.6 | 4.0 | 3.5 | 3.3 | 3.6 | ||
| 2011 | 4.1 | 6.4 | 6.2 | 5.5 | 8.5 | 2.1 | 6.8 | 4.6 | 1.6 | 2.5 | 0.4 | 2.3 | 3.5 | 6.2 | 4.5 | 1.5 | 4.0 | ||
| 2010 | 6.2 | 4.4 | 4.5 | 4.2 | 3.8 | 3.3 | 4.8 | 3.5 | 4.7 | 4.7 | 3.9 | 4.2 | 4.7 | 4.2 | 3.9 | 4.6 | 4.3 | ||
| 2009 | 2.2 | 6.2 | 6.8 | 5.5 | 8.0 | 5.3 | 4.0 | 5.0 | 4.2 | 4.1 | 3.1 | 2.7 | 3.3 | 6.4 | 4.8 | 3.9 | 5.0 | ||
| 2008 | 6.9 | 4.3 | 6.7 | 3.3 | 6.7 | 5.4 | 6.3 | 7.4 | 9.1 | 2.2 | 5.4 | 7.5 | 6.5 | 4.7 | 6.1 | 4.8 | 5.3 | ||
| 2007 | 6.6 | 8.3 | 7.9 | 7.0 | 5.4 | 12.4 | 5.9 | 5.2 | 3.0 | 2.1 | 6.5 | 3.3 | 4.9 | 7.0 | 8.7 | 3.4 | 6.2 | ||
| 2006 | 7.9 | 3.9 | 6.2 | 6.4 | 7.1 | 6.1 | 6.2 | 6.7 | 5.3 | 3.2 | 4.3 | 4.2 | 5.2 | 6.5 | 6.3 | 4.5 | 5.7 | ||
| 2005 | 4.4 | 1.9 | 9.7 | 6.1 | 4.8 | 4.0 | 4.3 | 5.4 | 3.5 | 4.4 | 8.0 | 5.7 | 4.6 | 7.4 | 4.3 | 5.2 | 5.5 | ||
| 2004 | 3.6 | 5.9 | 8.7 | 2.9 | 4.1 | 3.2 | 2.4 | 4.0 | 4.7 | 9.3 | 2.9 | 4.3 | 4.4 | 5.4 | 3.1 | 6.1 | 4.8 | ||
| 2003 | 4.3 | 7.9 | 5.9 | 4.1 | 6.4 | 4.7 | 4.4 | 2.7 | 3.6 | 3.7 | 8.5 | 5.0 | 5.8 | 5.6 | 4.0 | 4.7 | 5.0 | ||
| 2002 | 3.4 | 1.7 | 4.0 | 4.3 | 4.0 | 5.3 | 1.9 | 4.6 | 4.5 | 6.0 | 5.9 | 3.8 | 3.1 | 4.1 | 4.3 | 5.3 | 4.2 | ||
| 2001 | 3.1 | 2.4 | 5.0 | 2.1 | 2.8 | 4.0 | 5.5 | 4.6 | 2.4 | 1.5 | 3.5 | 4.4 | 3.4 | 3.6 | 4.6 | 2.4 | 3.5 | ||
| 2000 | 4.8 | 1.3 | 3.3 | 2.6 | 6.0 | 4.0 | 3.3 | 4.3 | 2.9 | 2.7 | 3.6 | 1.6 | 2.4 | 4.0 | 3.9 | 2.9 | 3.4 | ||
| 1999 | 2.9 | 4.1 | 8.0 | 3.1 | 1.9 | 4.4 | 5.8 | 5.7 | 3.2 | 3.1 | 4.0 | 4.7 | 4.3 | 4.5 | 5.3 | 3.4 | 4.3 | ||
| 1998 | 0.0 | 0.0 | 3.3 | 1.1 | 4.4 | 6.6 | 5.9 | 1.9 | 1.1 | 0.0 | 0.0 | 1.3 | 0.6 | 3.0 | 5.3 | 0.6 | 2.7 | ||
| 1997 | 1.1 | 0.0 | 0.9 | 1.3 | 6.8 | 6.7 | 2.0 | 1.8 | 0.0 | 3.7 | 0.0 | 4.2 | 1.8 | 3.3 | 4.2 | 2.1 | 2.9 | ||
| 1996 | 1.5 | 3.2 | 8.0 | 1.8 | 3.7 | 3.0 | 1.9 | 1.2 | 6.9 | 4.7 | 1.7 | 2.3 | 2.4 | 4.0 | 2.1 | 4.9 | 3.3 | ||
| 1995 | 2.2 | 0.8 | 1.0 | 1.2 | 2.7 | 2.3 | 10.6 | 3.2 | 2.0 | 2.4 | 5.2 | 6.4 | 2.8 | 1.6 | 6.1 | 3.0 | 3.2 | ||
| 1994 | 3.9 | 7.8 | 0.0 | 7.0 | 1.5 | 4.3 | 2.9 | 1.7 | 1.1 | 5.3 | 2.5 | 0.0 | 3.7 | 2.8 | 2.9 | 3.3 | 3.2 | ||
| 1993 | 0.0 | 2.6 | 6.5 | 5.3 | 6.1 | 2.2 | 4.1 | 0.0 | 4.9 | 0.0 | 3.9 | 1.4 | 1.5 | 5.9 | 2.4 | 3.2 | 3.4 | ||
| 1992 | 1.5 | 1.9 | 3.5 | 5.3 | 9.7 | 0.0 | 1.7 | 7.3 | 1.4 | 0.0 | 0.0 | 0.0 | 1.1 | 6.0 | 2.5 | 0.5 | 2.8 | ||
| 1991 | 0.8 | 1.1 | 2.3 | 2.9 | 3.1 | 2.7 | 3.6 | 4.0 | 1.6 | 5.1 | 0.0 | 4.0 | 1.5 | 2.8 | 3.3 | 2.2 | 2.4 | ||
| 1990 | 5.2 | 9.2 | 6.5 | 1.0 | 3.7 | 6.9 | 6.9 | 7.0 | 6.8 | 3.6 | 2.7 | 1.3 | 6.2 | 3.7 | 7.0 | 4.5 | 5.4 | ||
| 1989 | 6.6 | 7.3 | 9.2 | 6.5 | 8.6 | 11.3 | 11.7 | 12.4 | 7.2 | 5.6 | 3.3 | 3.6 | 6.0 | 8.0 | 11.8 | 5.5 | 7.9 | ||
| 1988 | 5.6 | 6.0 | 7.3 | 5.9 | 6.6 | 5.1 | 10.1 | 10.3 | 5.0 | 3.7 | 5.1 | 9.7 | 6.9 | 6.5 | 8.4 | 4.6 | 6.6 | ||
| 1987 | 0.0 | 0.0 | 3.2 | 3.1 | 5.7 | 5.2 | 4.6 | 2.5 | 6.7 | 6.2 | 2.6 | 2.9 | 2.6 | 4.2 | 4.0 | 5.1 | 4.3 | ||
| 1986 | 0.0 | 2.6 | 0.0 | 0.0 | 0.0 | 0.0 | 0.0 | 0.0 | 0.0 | 0.0 | 3.4 | 0.0 | 1.0 | 0.0 | 0.0 | 0.9 | 0.5 | ||
| 1985 | 0.0 | 0.0 | 0.0 | 0.0 | 0.0 | 0.0 | 0.0 | 0.0 | 0.0 | 0.0 | 0.0 | 0.0 | 0.0 | 0.0 | 0.0 | 0.0 | 0.0 | ||
| 1984 | 0.0 | 0.0 | 0.0 | 0.0 | 0.0 | 0.0 | 0.0 | 0.0 | 0.0 | 0.0 | 0.0 | 0.0 | 0.0 | 0.0 | 0.0 | 0.0 | 0.0 | ||
| 1983 | 0.0 | 0.0 | 0.0 | 0.0 | 0.0 | 0.0 | 0.0 | 0.0 | 0.0 | - | 0.0 | 0.0 | 0.0 | 0.0 | 0.0 | 0.0 | 0.0 | ||
| 1982 | - | 0.0 | - | 0.0 | 0.0 | 0.0 | - | 0.0 | - | 0.0 | - | 0.0 | 0.0 | 0.0 | 0.0 | 0.0 | 0.0 | ||
Breeding data
Breeding records by month
Number of breeding records by breeding code and month, 2017 and all years| Breeding code | Jul | Aug | Sep | Oct | Nov | Dec | Jan | Feb | Mar | Apr | May | Jun |
|---|---|---|---|---|---|---|---|---|---|---|---|---|
| 2017 | ||||||||||||
| Breeding (BLA code) | 0 | 0 | 0 | 0 | 0 | 0 | 0 | 0 | 0 | 0 | 0 | 0 |
| Carrying Food | 0 | 0 | 0 | 0 | 0 | 0 | 2 | 0 | 0 | 0 | 0 | 0 |
| Copulating | 0 | 0 | 0 | 0 | 0 | 0 | 0 | 0 | 0 | 0 | 0 | 0 |
| Display | 0 | 0 | 0 | 0 | 0 | 0 | 0 | 0 | 0 | 0 | 0 | 0 |
| Dependent young | 0 | 0 | 0 | 2 | 0 | 0 | 2 | 1 | 0 | 1 | 0 | 0 |
| Faecal sac | 0 | 0 | 0 | 0 | 0 | 0 | 0 | 0 | 0 | 0 | 0 | 0 |
| Inspecting hollow | 0 | 0 | 0 | 0 | 0 | 0 | 0 | 0 | 0 | 0 | 0 | 0 |
| Nest building | 0 | 0 | 0 | 2 | 0 | 0 | 0 | 0 | 0 | 0 | 0 | 0 |
| Nest with eggs | 0 | 0 | 0 | 0 | 0 | 0 | 0 | 0 | 0 | 0 | 0 | 0 |
| Nest with young | 0 | 0 | 0 | 0 | 0 | 0 | 2 | 0 | 0 | 0 | 0 | 0 |
| On/leaving nest | 0 | 0 | 0 | 0 | 0 | 0 | 0 | 0 | 0 | 0 | 0 | 0 |
| All years | ||||||||||||
| Breeding (BLA code) | 0 | 0 | 0 | 1 | 1 | 2 | 1 | 1 | 1 | 0 | 0 | 0 |
| Carrying Food | 0 | 0 | 0 | 0 | 2 | 0 | 2 | 0 | 0 | 0 | 0 | 0 |
| Copulating | 1 | 0 | 0 | 1 | 0 | 0 | 1 | 0 | 0 | 0 | 0 | 0 |
| Display | 0 | 0 | 0 | 0 | 0 | 0 | 0 | 0 | 0 | 0 | 0 | 0 |
| Dependent young | 0 | 0 | 0 | 7 | 14 | 6 | 21 | 6 | 4 | 2 | 0 | 0 |
| Faecal sac | 0 | 0 | 0 | 0 | 0 | 0 | 0 | 0 | 0 | 0 | 0 | 0 |
| Inspecting hollow | 0 | 0 | 0 | 0 | 0 | 0 | 0 | 0 | 0 | 0 | 0 | 0 |
| Nest building | 0 | 2 | 2 | 2 | 1 | 0 | 0 | 0 | 0 | 0 | 0 | 0 |
| Nest with eggs | 0 | 0 | 0 | 0 | 0 | 0 | 0 | 0 | 0 | 0 | 0 | 0 |
| Nest with young | 0 | 0 | 0 | 1 | 1 | 1 | 3 | 0 | 1 | 0 | 0 | 0 |
| On/leaving nest | 0 | 1 | 0 | 1 | 0 | 0 | 0 | 0 | 0 | 0 | 0 | 0 |
Breeding records by year
Average number of breeding records per period by breeding code| Period | Breeding (BLA code) | Carrying Food | Copulating | Display | Dependent young | Faecal sac | Inspecting hollow | Nest building | Nest with eggs | Nest with young | On/leaving nest |
|---|---|---|---|---|---|---|---|---|---|---|---|
| All years | |||||||||||
| All | 0.2 | 0.1 | 0.1 | 0.0 | 1.7 | 0.0 | 0.0 | 0.2 | 0.0 | 0.2 | 0.1 |
| Previous years | |||||||||||
| All previous years | 0.2 | 0.1 | 0.1 | 0.0 | 1.5 | 0.0 | 0.0 | 0.1 | 0.0 | 0.1 | 0.1 |
| Previous 30 years | 0.2 | 0.1 | 0.1 | 0.0 | 1.8 | 0.0 | 0.0 | 0.2 | 0.0 | 0.2 | 0.1 |
| Previous 20 years | 0.3 | 0.1 | 0.1 | 0.0 | 1.9 | 0.0 | 0.0 | 0.2 | 0.0 | 0.2 | 0.1 |
| 10 year groups | |||||||||||
| [2007,2017) | 0.5 | 0.1 | 0.2 | 0.0 | 3.1 | 0.0 | 0.0 | 0.2 | 0.0 | 0.2 | 0.1 |
| [1997,2007) | 0.2 | 0.1 | 0.1 | 0.0 | 0.6 | 0.0 | 0.0 | 0.2 | 0.0 | 0.2 | 0.1 |
| [1987,1997) | 0.0 | 0.0 | 0.0 | 0.0 | 1.7 | 0.0 | 0.0 | 0.1 | 0.0 | 0.1 | 0.0 |
| 5 year groups | |||||||||||
| [2012,2017) | 1.0 | 0.2 | 0.4 | 0.0 | 4.8 | 0.0 | 0.0 | 0.2 | 0.0 | 0.4 | 0.0 |
| [2007,2012) | 0.0 | 0.0 | 0.0 | 0.0 | 1.4 | 0.0 | 0.0 | 0.2 | 0.0 | 0.0 | 0.2 |
| [2002,2007) | 0.4 | 0.2 | 0.0 | 0.0 | 0.4 | 0.0 | 0.0 | 0.4 | 0.0 | 0.2 | 0.2 |
| [1997,2002) | 0.0 | 0.0 | 0.2 | 0.0 | 0.8 | 0.0 | 0.0 | 0.0 | 0.0 | 0.2 | 0.0 |
| [1992,1997) | 0.0 | 0.0 | 0.0 | 0.0 | 0.8 | 0.0 | 0.0 | 0.0 | 0.0 | 0.0 | 0.0 |
| [1987,1992) | 0.0 | 0.0 | 0.0 | 0.0 | 2.6 | 0.0 | 0.0 | 0.2 | 0.0 | 0.2 | 0.0 |
| Year | |||||||||||
| 2017 | 0.0 | 2.0 | 0.0 | 0.0 | 6.0 | 0.0 | 0.0 | 2.0 | 0.0 | 2.0 | 0.0 |
| 2016 | 0.0 | 0.0 | 1.0 | 0.0 | 10.0 | 0.0 | 0.0 | 0.0 | 0.0 | 1.0 | 0.0 |
| 2015 | 0.0 | 0.0 | 0.0 | 0.0 | 5.0 | 0.0 | 0.0 | 1.0 | 0.0 | 0.0 | 0.0 |
| 2014 | 0.0 | 0.0 | 0.0 | 0.0 | 4.0 | 0.0 | 0.0 | 0.0 | 0.0 | 0.0 | 0.0 |
| 2013 | 2.0 | 1.0 | 1.0 | 0.0 | 2.0 | 0.0 | 0.0 | 0.0 | 0.0 | 1.0 | 0.0 |
| 2012 | 3.0 | 0.0 | 0.0 | 0.0 | 3.0 | 0.0 | 0.0 | 0.0 | 0.0 | 0.0 | 0.0 |
| 2011 | 0.0 | 0.0 | 0.0 | 0.0 | 1.0 | 0.0 | 0.0 | 0.0 | 0.0 | 0.0 | 0.0 |
| 2010 | 0.0 | 0.0 | 0.0 | 0.0 | 2.0 | 0.0 | 0.0 | 0.0 | 0.0 | 0.0 | 0.0 |
| 2009 | 0.0 | 0.0 | 0.0 | 0.0 | 3.0 | 0.0 | 0.0 | 0.0 | 0.0 | 0.0 | 0.0 |
| 2008 | 0.0 | 0.0 | 0.0 | 0.0 | 1.0 | 0.0 | 0.0 | 0.0 | 0.0 | 0.0 | 0.0 |
| 2007 | 0.0 | 0.0 | 0.0 | 0.0 | 0.0 | 0.0 | 0.0 | 1.0 | 0.0 | 0.0 | 1.0 |
| 2006 | 1.0 | 1.0 | 0.0 | 0.0 | 0.0 | 0.0 | 0.0 | 0.0 | 0.0 | 0.0 | 1.0 |
| 2005 | 1.0 | 0.0 | 0.0 | 0.0 | 1.0 | 0.0 | 0.0 | 1.0 | 0.0 | 0.0 | 0.0 |
| 2004 | 0.0 | 0.0 | 0.0 | 0.0 | 0.0 | 0.0 | 0.0 | 0.0 | 0.0 | 0.0 | 0.0 |
| 2003 | 0.0 | 0.0 | 0.0 | 0.0 | 0.0 | 0.0 | 0.0 | 1.0 | 0.0 | 0.0 | 0.0 |
| 2002 | 0.0 | 0.0 | 0.0 | 0.0 | 1.0 | 0.0 | 0.0 | 0.0 | 0.0 | 1.0 | 0.0 |
| 2001 | 0.0 | 0.0 | 0.0 | 0.0 | 2.0 | 0.0 | 0.0 | 0.0 | 0.0 | 1.0 | 0.0 |
| 2000 | 0.0 | 0.0 | 1.0 | 0.0 | 0.0 | 0.0 | 0.0 | 0.0 | 0.0 | 0.0 | 0.0 |
| 1999 | 0.0 | 0.0 | 0.0 | 0.0 | 1.0 | 0.0 | 0.0 | 0.0 | 0.0 | 0.0 | 0.0 |
| 1998 | 0.0 | 0.0 | 0.0 | 0.0 | 1.0 | 0.0 | 0.0 | 0.0 | 0.0 | 0.0 | 0.0 |
| 1997 | 0.0 | 0.0 | 0.0 | 0.0 | 0.0 | 0.0 | 0.0 | 0.0 | 0.0 | 0.0 | 0.0 |
| 1996 | 0.0 | 0.0 | 0.0 | 0.0 | 2.0 | 0.0 | 0.0 | 0.0 | 0.0 | 0.0 | 0.0 |
| 1995 | 0.0 | 0.0 | 0.0 | 0.0 | 1.0 | 0.0 | 0.0 | 0.0 | 0.0 | 0.0 | 0.0 |
| 1994 | 0.0 | 0.0 | 0.0 | 0.0 | 1.0 | 0.0 | 0.0 | 0.0 | 0.0 | 0.0 | 0.0 |
| 1993 | 0.0 | 0.0 | 0.0 | 0.0 | 0.0 | 0.0 | 0.0 | 0.0 | 0.0 | 0.0 | 0.0 |
| 1992 | 0.0 | 0.0 | 0.0 | 0.0 | 0.0 | 0.0 | 0.0 | 0.0 | 0.0 | 0.0 | 0.0 |
| 1991 | 0.0 | 0.0 | 0.0 | 0.0 | 1.0 | 0.0 | 0.0 | 0.0 | 0.0 | 0.0 | 0.0 |
| 1990 | 0.0 | 0.0 | 0.0 | 0.0 | 2.0 | 0.0 | 0.0 | 0.0 | 0.0 | 0.0 | 0.0 |
| 1989 | 0.0 | 0.0 | 0.0 | 0.0 | 2.0 | 0.0 | 0.0 | 1.0 | 0.0 | 1.0 | 0.0 |
| 1988 | 0.0 | 0.0 | 0.0 | 0.0 | 6.0 | 0.0 | 0.0 | 0.0 | 0.0 | 0.0 | 0.0 |
| 1987 | 0.0 | 0.0 | 0.0 | 0.0 | 2.0 | 0.0 | 0.0 | 0.0 | 0.0 | 0.0 | 0.0 |
| 1986 | 0.0 | 0.0 | 0.0 | 0.0 | 0.0 | 0.0 | 0.0 | 0.0 | 0.0 | 0.0 | 0.0 |
| 1985 | 0.0 | 0.0 | 0.0 | 0.0 | 0.0 | 0.0 | 0.0 | 0.0 | 0.0 | 0.0 | 0.0 |
| 1984 | 0.0 | 0.0 | 0.0 | 0.0 | 0.0 | 0.0 | 0.0 | 0.0 | 0.0 | 0.0 | 0.0 |
| 1983 | 0.0 | 0.0 | 0.0 | 0.0 | 0.0 | 0.0 | 0.0 | 0.0 | 0.0 | 0.0 | 0.0 |
| 1982 | 0.0 | 0.0 | 0.0 | 0.0 | 0.0 | 0.0 | 0.0 | 0.0 | 0.0 | 0.0 | 0.0 |
Distribution map
Distribution - 2017
This map shows the observed distribution of the Brown-headed Honeyeater for 2017.
The red circles are the grid cells where Brown-headed Honeyeater have been reported.
The transparency of the red circles indicate how many surveys sheets were submitted for that grid cell; the darker the red the more reliable the data. Of the 315 grid cells with reports, 83 had only one sheet; an example is grid number M6.
The size of the circle represents the reporting rate. The maximum reporting rate for Brown-headed Honeyeater was 100.0% (eg grid number M6) and the minimum was 0.2% (eg grid number L13). 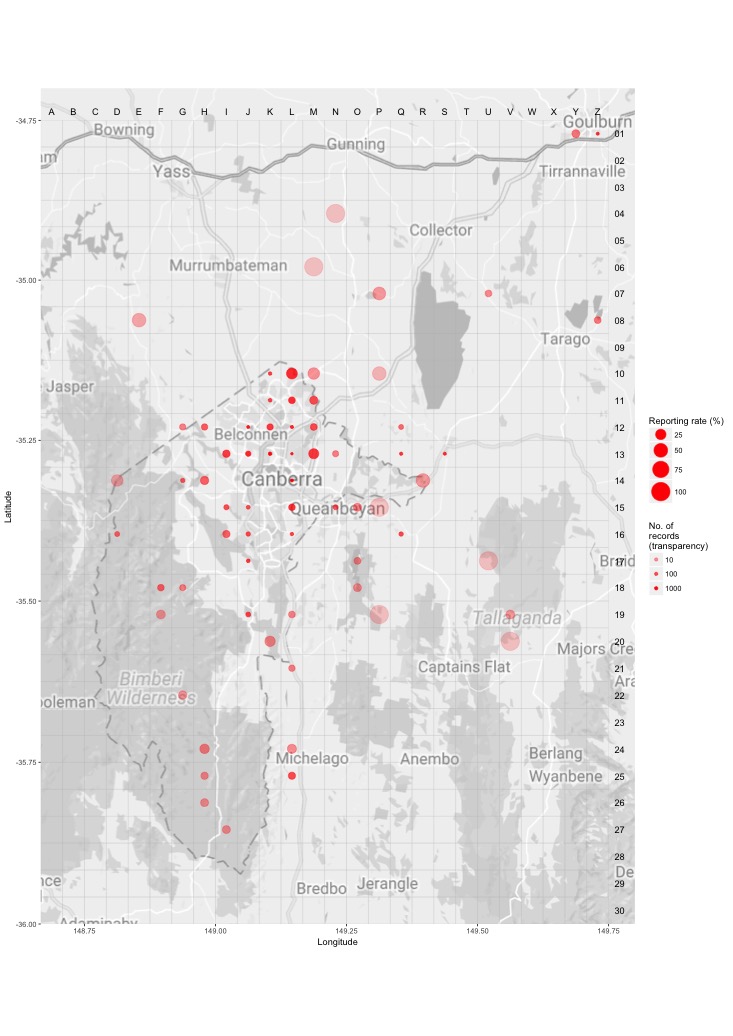
Distribution - all years
This map shows the observed distribution of the Brown-headed Honeyeater for all years.
The red circles are the grid cells where Brown-headed Honeyeater have been reported.
The transparency of the red circles indicate how many surveys sheets were submitted for that grid cell; the darker the red the more reliable the data. Of the 703 grid cells with reports, 55 had only one sheet; an example is grid number V28.
The size of the circle represents the reporting rate. The maximum reporting rate for Brown-headed Honeyeater was 100.0% (eg grid number V28) and the minimum was 0.1% (eg grid number I12). 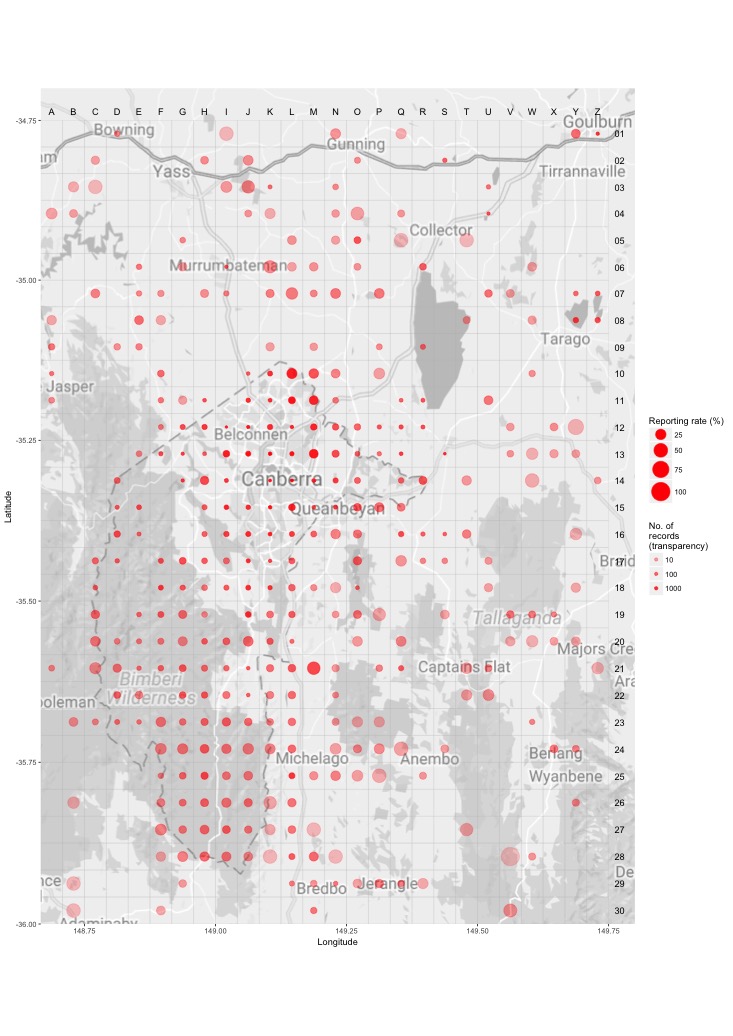
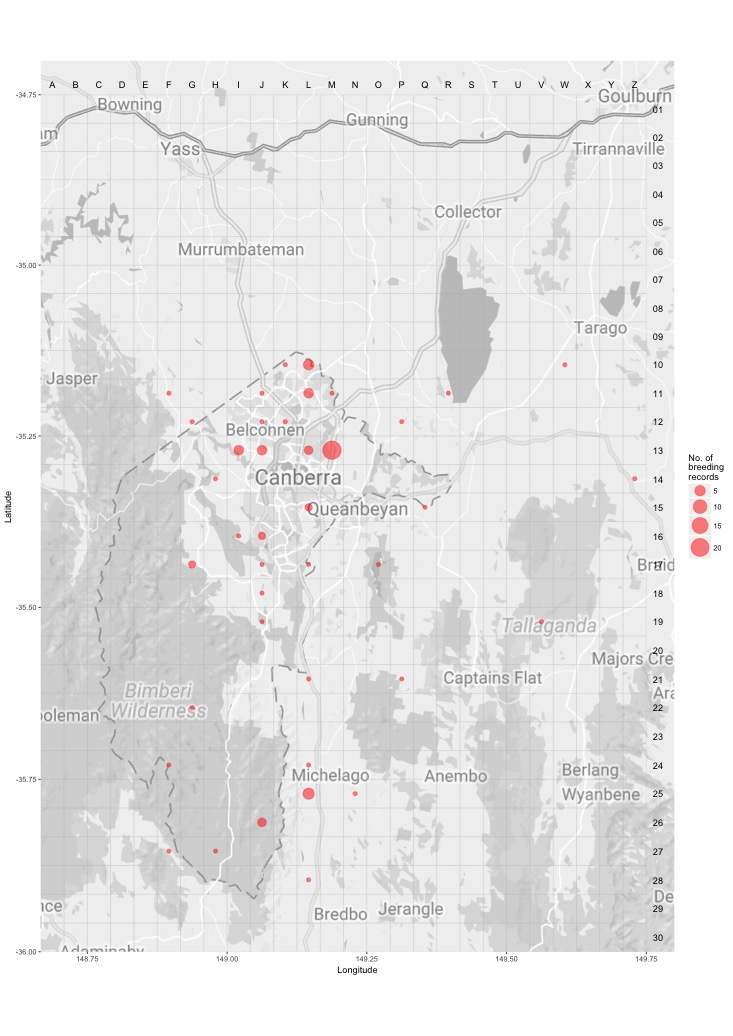
Breeding map
Breeding - 2017
This map shows the breeding distribution of the Brown-headed Honeyeater for 2017.
The red circles are the grid cells where breeding activity for Brown-headed Honeyeater have been reported.
The size of the circle represents the number of reports. 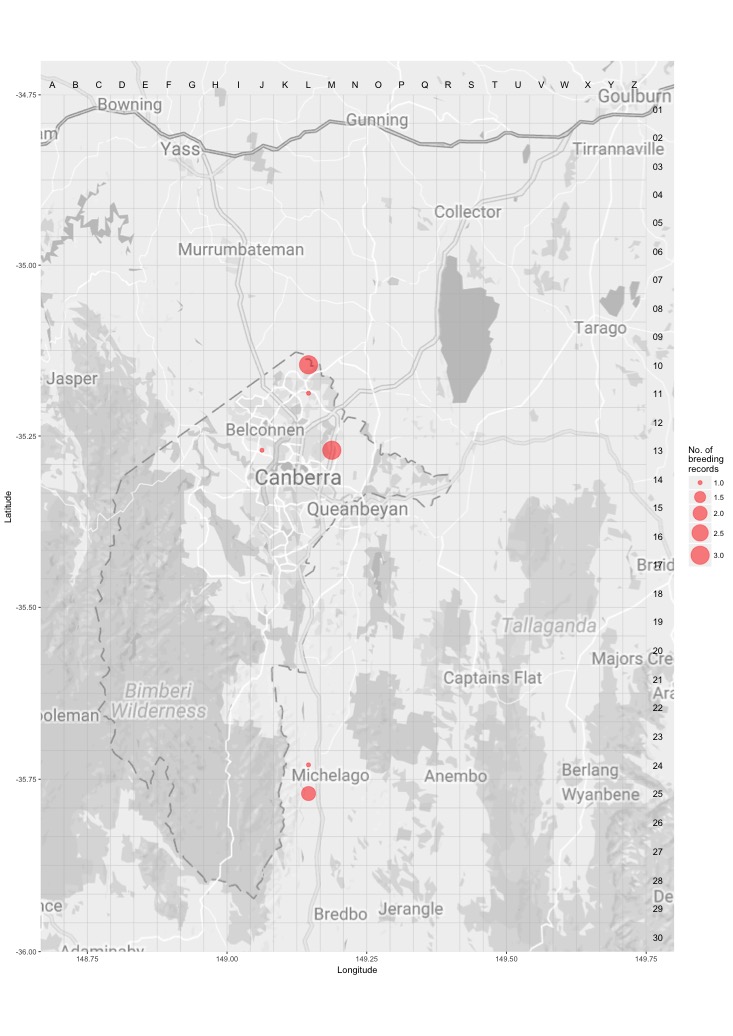
Breeding - all years
This map shows the breeding distribution of the Brown-headed Honeyeater for all years.
The red circles are the grid cells where breeding activity for Brown-headed Honeyeater have been reported.
The size of the circle represents the number of reports.